If you invest on Chicago’s North Side, cap rates help you compare Bucktown to Logan Square. But headline yields only tell part of the story. The right decision balances today’s cash flow with risk, growth, and exit liquidity.
Cap rates in Bucktown and Logan Square
What readers should expect
This guide gives you a clear framework to compare Bucktown and Logan Square through a risk–reward lens. You will see how cap rates are calculated, what they signal, and when they mislead. Then we will stack the neighborhoods side by side using factors that move returns: tenant demand, amenities and transit, policy and pipeline, and operating costs. We will run through core versus value‑add scenarios, sensitivities that matter, and how financing and taxes reshape yield. The goal is not to cherry‑pick one “best” number, but to show you how to choose the path that fits your strategy, hold period, and tolerance for execution risk.
Cap rate basics and risk–return
How cap rates are calculated
- Cap rate = Net Operating Income ÷ Purchase Price. It is an unlevered, point‑in‑time yield you can use to compare income properties as defined by Investopedia.
- NOI should reflect realistic income minus normal operating expenses. Watch for inconsistent expense treatment, property tax underwrites, and missing reserves. In mixed‑use, separate residential and retail assumptions.
What cap rates signal
- Lower cap rates often reflect stronger perceived stability, better locations, and deeper buyer pools. Investors accept a lower yield today for liquidity or growth.
- Higher cap rates signal higher perceived risk: operational complexity, older vintage, weaker tenant demand, retail exposure, or policy/tax uncertainty.
- Chicago metro context helps. Recent reporting places the area’s multifamily cap rate near the high‑6 percent range, roughly 6.8 percent. Neighborhood deals will float around that anchor depending on asset and risk per a Chicago multifamily market report.
When cap rate comparisons mislead
- Apples-to-oranges inputs: vintage, unit mix, rent control exposure, tax phase‑in, and HOA/assessment costs can distort caps.
- Vacancy and turnover: value‑add units with downtime can show attractive “pro forma” caps that require execution to realize.
- Exit assumptions: a low going‑in cap may still win if rent growth is durable and exit liquidity is deep; the reverse is also true.
Bucktown vs. Logan Square factors
Asset types and tenant demand
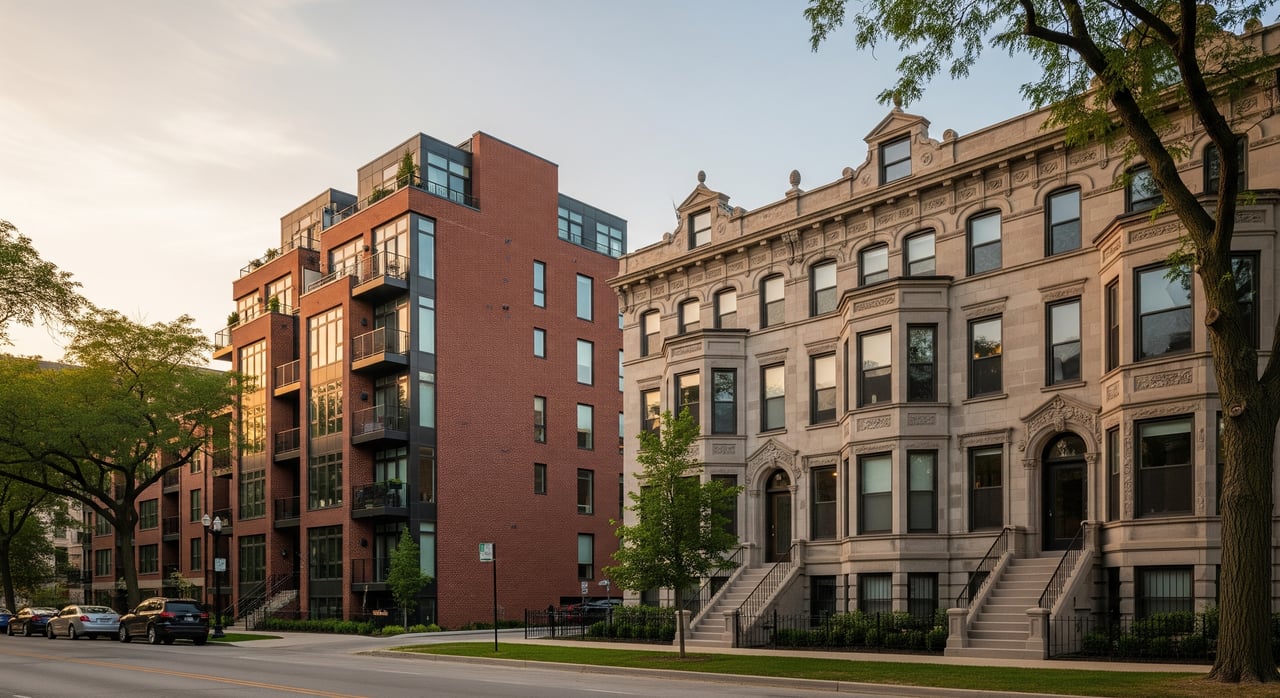
- Bucktown: a mix of renovated walk‑ups, newer condos, and small mixed‑use on retail corridors. Leasing velocity is strong for updated units near transit and boutique retail. Rents tend to be higher than in Logan Square, supporting NOI but also higher pricing.
- Logan Square: broad housing stock from classic greystones to mid‑renovation walk‑ups and mixed‑use near The 606. Tenant demand is vibrant, with an arts and food scene that supports absorption, but older vintage and heavier value‑add opportunities can lift operational risk and expected cap rates.
- Listing snapshots suggest both areas frequently trade near, slightly below, or slightly above metro caps depending on condition and retail exposure. Sample Bucktown listings show mid‑5 to high‑6 percent asking caps, with examples around 6.36 to roughly 6.5 percent on small multifamily and mixed‑use via representative listings on LoopNet and PropertyShark. Logan Square small‑multifamily samples cluster around the mid‑6 percent band on commercial aggregators see representative listings, with an example of a fully leased 7‑unit trading near $3.17 million that underscores buyer demand and pricing depth as reported by CRE MarketBeat.
Amenities, transit, and lifestyle drivers
- Bucktown benefits from proximity to Wicker Park, Damen/Milwaukee transit, and boutique retail. These factors compress cap rates because investors pay for rent growth and liquidity.
- Logan Square’s restaurant scene, boulevards, and 606 access pull strong demand while leaving room for value‑add upside in older stock. Neighborhood rent snapshots indicate Bucktown’s average asking rents exceed Logan Square’s, which supports NOI but also purchase premiums see RentCafe’s neighborhood data.
Development pipeline and policy environment
- The 606 reshaped pricing on the Northwest Side. Research and reporting document price gains, preservation pushes, and anti‑deconversion rules that influence future supply and investor calculus UIC Voorhees Center and Curbed coverage.
- Translation: policy can stabilize neighborhoods and cap speculative supply, yet it can also add friction to redevelopment, which may widen cap rates for heavier value‑add plays.
Data sources and normalization
- Use consistent underwriting inputs for both neighborhoods: realistic vacancy, professional management, insurance, utilities, routine maintenance, capital reserves, and taxes. Align unit mix and vintage to compare like for like. Market‑level fundamentals such as mid‑single‑digit vacancy and steady rent growth provide supportive backdrop but do not replace property‑level diligence see Chicago multifamily context.
Risk‑adjusted comparison and scenarios
Core vs. value‑add paths
- Turnkey stabilized core: Bucktown renovated 6‑unit near transit, long leases, minimal deferred maintenance. Expect tighter going‑in cap and strong leasing stability. The play is modest cash flow with an emphasis on durable rent and deep buyer pools at exit.
- Light value‑add: Logan Square classic walk‑up with cosmetic upgrades and turnover-driven rent lifts. Going‑in cap may be near metro averages or slightly higher, with near‑term cash flow dips during unit turns and upside as rents reset.
- Heavy rehab/mixed‑use: Either neighborhood along a retail corridor with ground‑floor vacancy and mechanicals due. Highest potential cap but with execution, lease‑up, and retail risk. Underwrite longer timelines and leasing costs.
Sensitivity tests that matter
- Rent growth: A one percentage point swing in annual rent growth materially shifts 5‑year total returns. In Bucktown, lower vacancy can help compounding stick; in Logan Square, value‑add rent resets can outperform if executed well.
- Vacancy: A two‑month downtime in a 6‑unit wipes out thousands in NOI. Model conservative rollover and make‑ready budgets.
- Taxes: Cook County reassessments can move the needle. Higher effective rates than national averages and periodic increases require tax stress tests and appeal plans regional reporting on effective rates and Treasurer resources.
- Exit cap: A 25–50 basis point change at exit can swing IRR more than a 50 basis point change in going‑in cap. Tie exit assumptions to buyer pool depth for your asset class.
Exit strategy and liquidity
- Bucktown: generally deeper buyer pools for renovated multifamily near Damen/Milwaukee and the 606. Expect tighter exit caps for clean, stabilized assets.
- Logan Square: active buyer pool, particularly for well‑located value‑add that has been de‑risked. Exit caps can be attractive if you deliver upgraded units with stabilized operations. Policy or supply changes near the 606 should factor into your hold and exit plan.
Financing, taxes, and operations impact
Debt terms and leverage
Debt resets the math. Interest rates, amortization, and DSCR covenants can push a paper 6.5 percent cap into thin cash‑on‑cash if leverage is aggressive. Tie your target cap to current lender pricing in Chicago and size debt to sustainable DSCR, not maximum LTV financing fundamentals overview.
Property taxes and assessments
Cook County tax changes are a core driver of realized yield. Underwrite tax increases post‑sale, plan appeals timelines, and avoid pro formas that hold taxes flat. For mixed‑use, split retail versus residential assessments and model vacancy loss. Chicago’s effective property tax burden has been reported above national averages, so bake in cushion regional reporting and review county resources for updates and deadlines Treasurer’s office portal.
Management, maintenance, and reserves
- Professional management: include 5 to 8 percent of EGI for small multifamily, plus leasing fees and marketing.
- Turnover: budget unit turns consistent with vintage and finish level; older stock near the 606 may require higher make‑ready.
- Insurance and reserves: rising premiums and capital items like roofs, porches, boilers, and tuckpointing need recurring reserves. Underwrite preventive maintenance to protect NOI.
Investor fit and strategy
Match goals to neighborhood profile
- Seeking stability and liquidity with lighter oversight? Prioritize renovated Bucktown assets near transit and retail, accept a tighter cap, and aim for growth and clean exit.
- Comfortable with light construction and tenant turns? Logan Square value‑add can deliver higher going‑in yield and forced appreciation, with more hands‑on execution.
- Mixed‑use appetite? Demand a return premium for retail exposure in either neighborhood and diversify tenant risk.
Sourcing, underwriting, and execution
- Define your buy box by unit count, vintage, target rent band, and required yield.
- Gather rent rolls, T‑12s, lease terms, and contractor bids early. Normalize expenses for taxes, management, reserves, and insurance.
- Stress test rents, vacancy, taxes, and exit cap. Use metro cap context to sanity‑check targets Chicago cap benchmark reference.
- Confirm zoning, permit history, and any 606‑adjacent policy constraints before closing policy context and reporting.
Mitigating risk before closing
- Full inspections and scope for structural, mechanicals, porches, roofs, and life‑safety.
- Verify rent rolls, security deposits, estoppels, and any retail CAM reconciliations.
- Tax projections with appeal strategy; insurance quotes in today’s market.
- Contingency plan for delays, cost overruns, and permitting.
Key takeaways and next steps
- Bucktown often trades at tighter caps thanks to lifestyle drivers and deep buyer pools. Logan Square can offer modestly higher caps and value‑add upside, with policy and execution to manage.
- The Chicago metro cap backdrop near the high‑6 percent range frames expectations, but property‑level underwriting, taxes, financing, and exit assumptions drive actual returns.
- Build your decision on normalized numbers, not marketing caps. Match neighborhood and asset type to your risk tolerance and operational bandwidth.
If you want a second set of eyes on underwriting or a curated buy box with off‑market leads, I can help you translate strategy into action. For tailored acquisition plans, stress tests, and exit roadmaps, connect with Patrick O’Brien. Let’s align your next purchase with the right balance of risk and reward.
FAQs
What is a good cap rate for Bucktown or Logan Square?
- It depends on asset type, condition, and risk. Use the Chicago metro benchmark near the high‑6 percent range as context, then adjust for location quality, vintage, and execution market context.
Why do Bucktown deals often have lower caps than Logan Square?
- Stronger perceived stability, higher rents, and deeper buyer pools compress yields. Logan Square has more value‑add stock, which can push caps higher to compensate for execution risk and policy factors near the 606 policy context and reporting.
Are listing cap rates reliable?
- Treat asking caps as starting points. Verify income and normalize expenses, especially taxes and reserves. Closed‑sale yields can differ from marketing figures general cap guidance and market comps context.
How do Cook County taxes affect my return?
Does financing change which neighborhood I should target?
- Yes. Debt terms, DSCR, and amortization shift cash‑on‑cash more than headline cap rates. Size leverage to sustainable coverage and price risk appropriately financing overview.
Where can I find current listings to benchmark caps?
- Commercial listing aggregators publish asking caps that help set expectations for small multifamily in each neighborhood Bucktown samples and Logan Square samples. Always verify numbers and normalize expenses.